Your partner for smarter data & automation
We help retail businesses unify their data, build intelligent dashboards, and enrich their data with AI
What we do
At Niventura, we help retail businesses level up their data. From connecting scattered systems to automating insights and unlocking AI intelligence. Whether you’re building your data foundation, standardizing dashboards and KPIs, or scaling with unified data & AI, we make each step seamless and built for growth across any of the cloud tools.


Key Services:
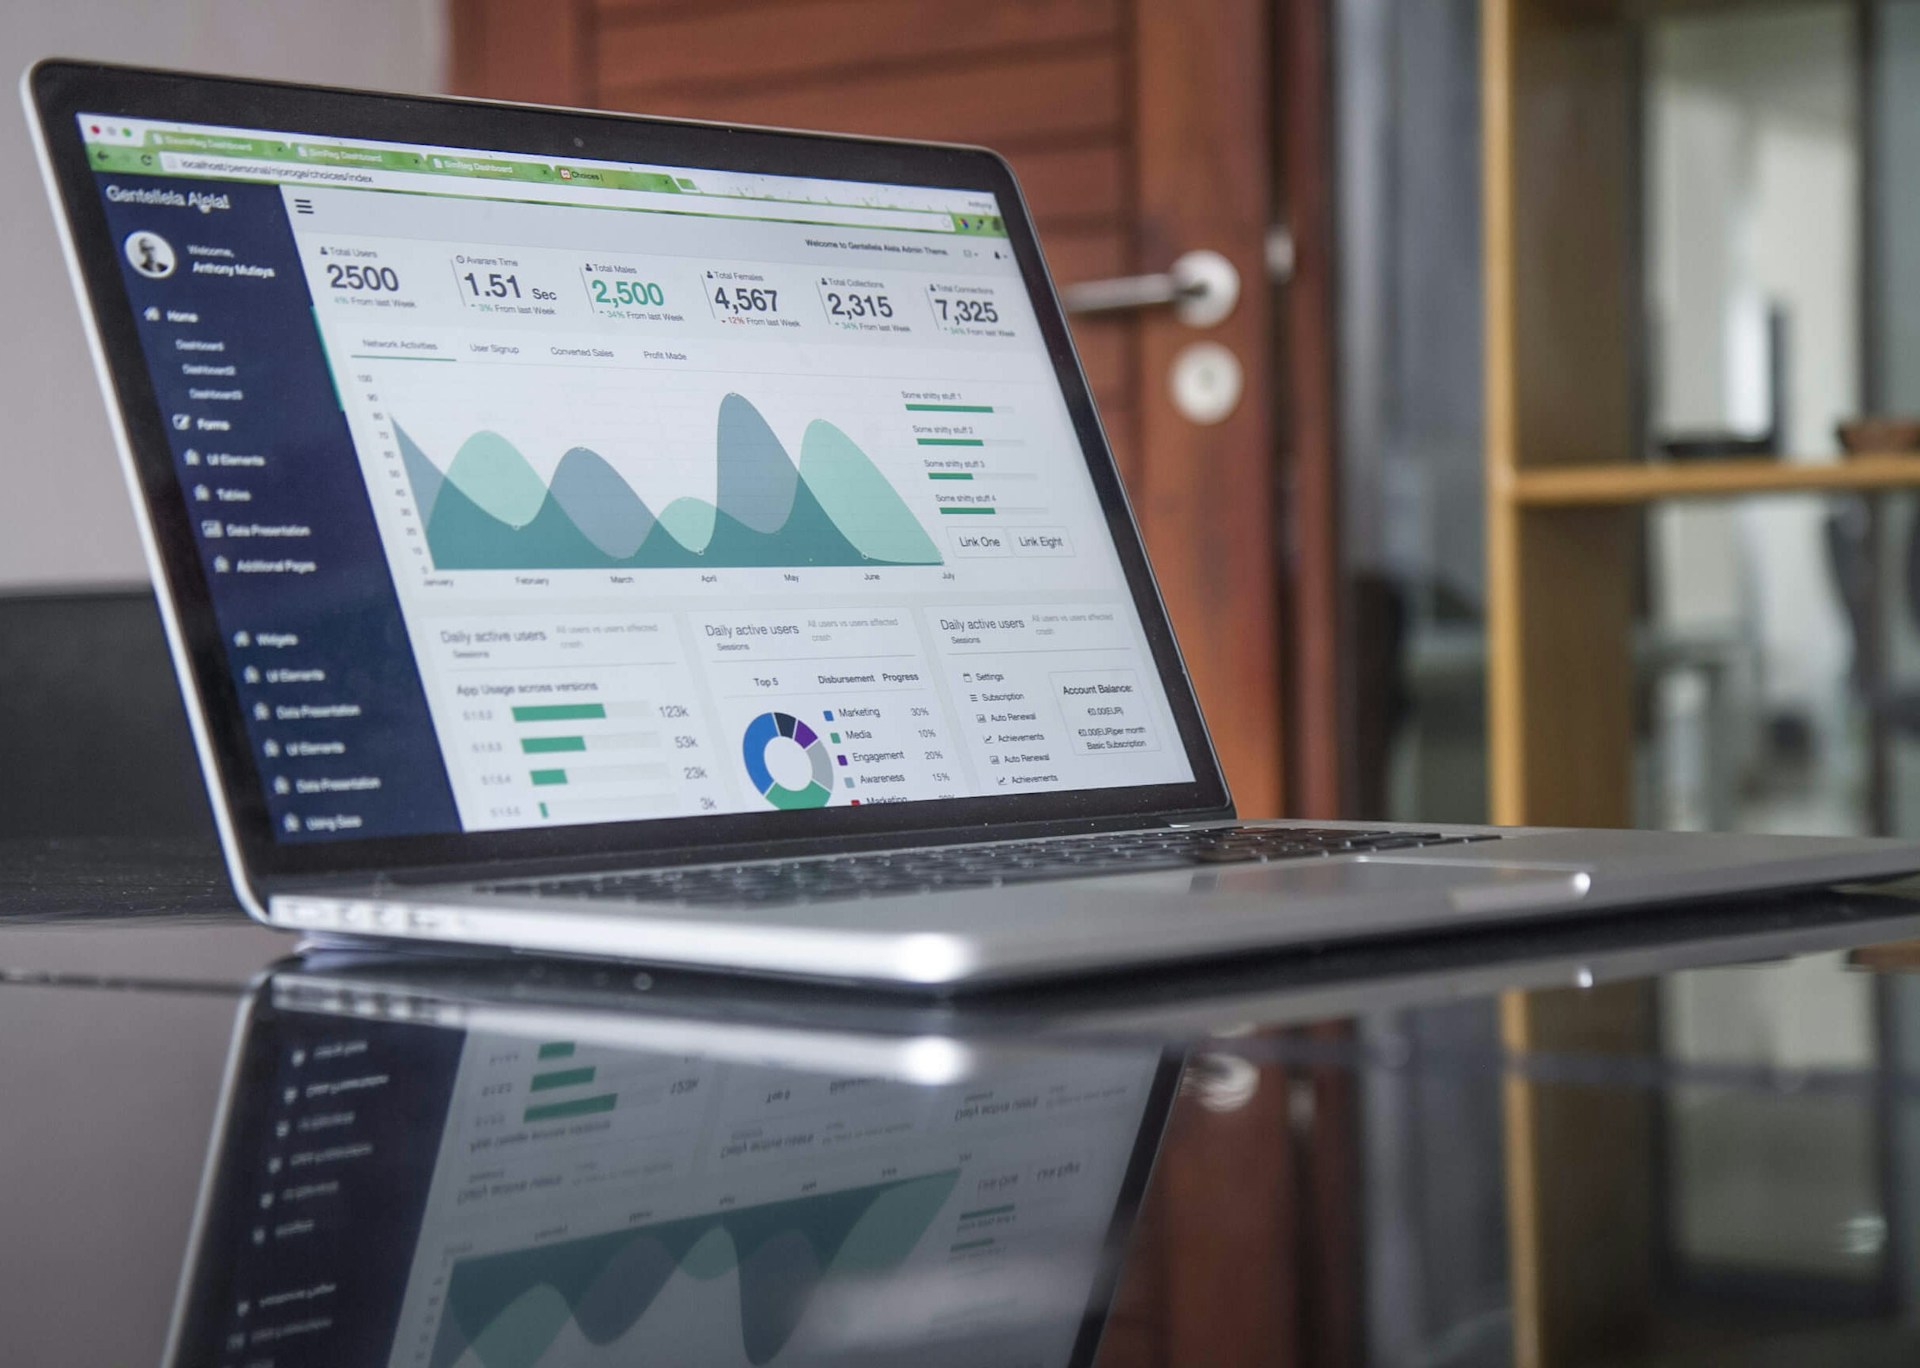
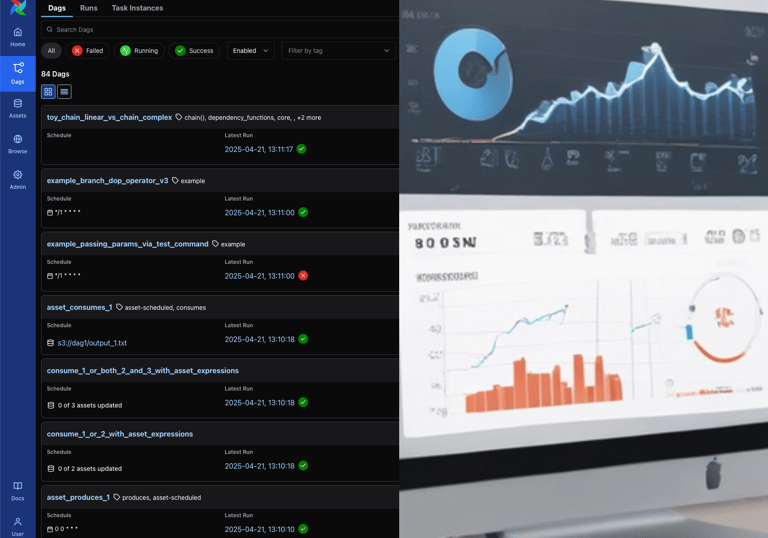
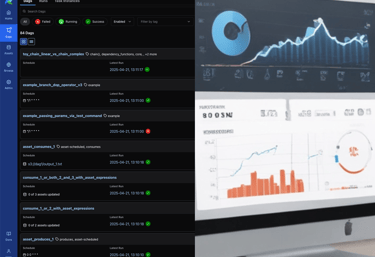
Data Integrations & Analytics Dashboard
Build data engineering pipelines, connect scattered data from different apps, clean data, and visualize performance in clear dashboards and analytics reports.
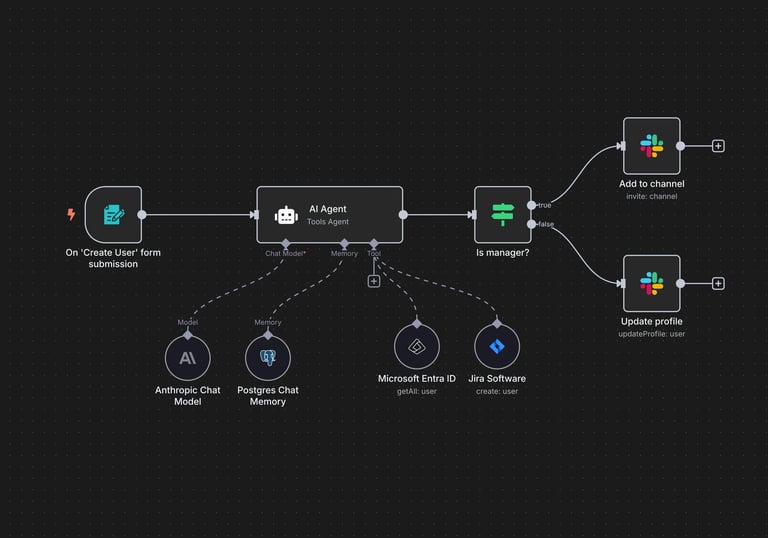
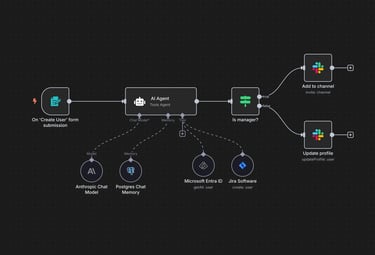
Workflow Integration & AI Automation
Automate repetitive tasks and design AI-powered workflows that boost productivity.
We train teams on tools like Power BI, Airflow, Databricks and more. Plus, we handle ongoing analytics support so your data pipelines and dashboards stay fresh, accurate, and hassle-free.
Training & Managed Analytics


Why Work With Us
Discover how we can help your business.


Retail Focused Expertise
We try to help data challenges unique to retail, from operations to reporting.
Built for Growth
very system we design scales with your business, no matter which tools you use.
Trustful Partnership
From data pipelines to AI intelligence, we help your team move confidently through every stage of data maturity
Niventura transformed our data processes, delivering insightful BI dashboards that enhanced our decision-making. Their expertise in analytics is unmatched!
John D.

★★★★★

Let's talk about your data project
Every business has unique data needs. Tell us about your project, and we’ll work with you to design the right solution. No question is too small and we’re here to help.